

Designed for saving fuel & reducing emissions – the ECO Unit is an effective device
If you use any of the following fuels; the ECO unit will assist you in reducing emissions
Diesel, Petrol, Heating oil, Kerosene, Methane (Natural Gas), LPG (Liquid Petroleum Gas) or Propane;
“In reducing emissions the ECO unit will reduce pollutant emission gases by up to 95%”
Core benefits to you when using the ECO Unit
• It’s a small effective device that provides a simple solution
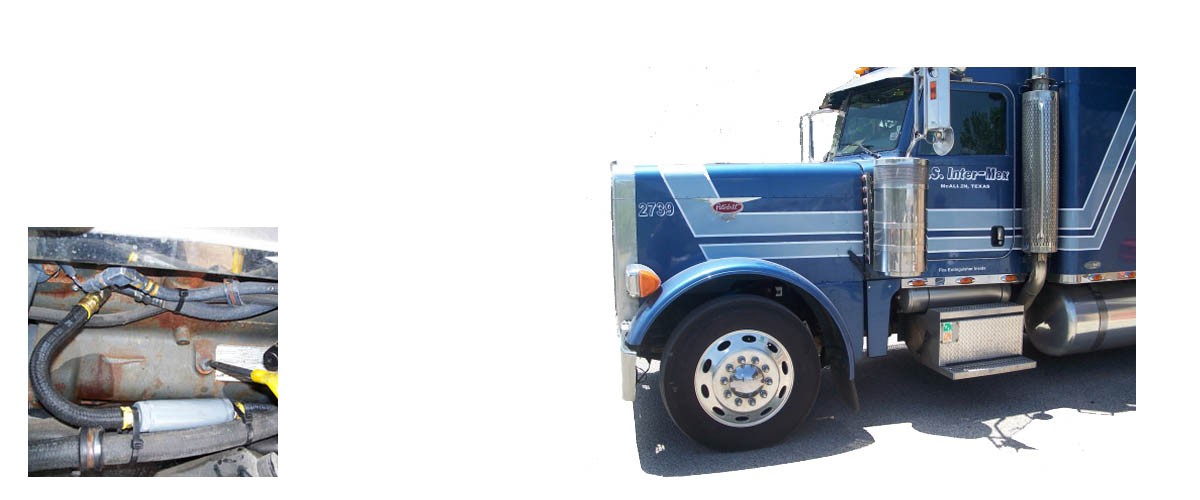
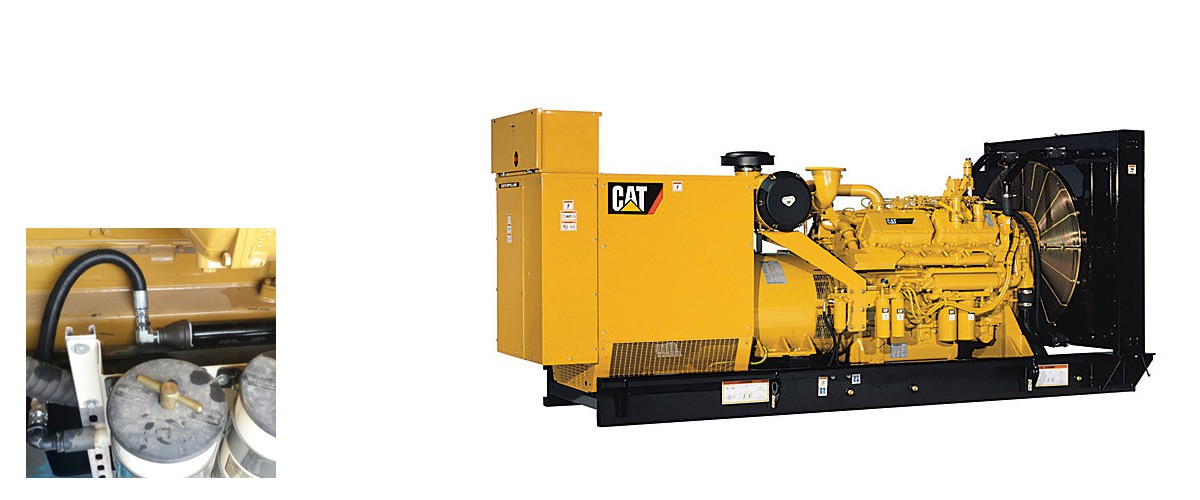
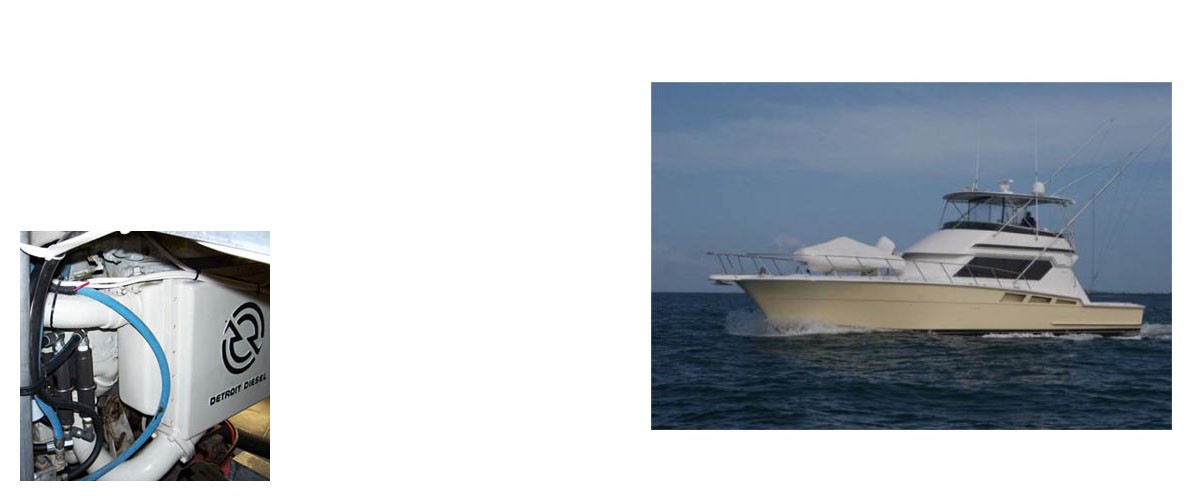
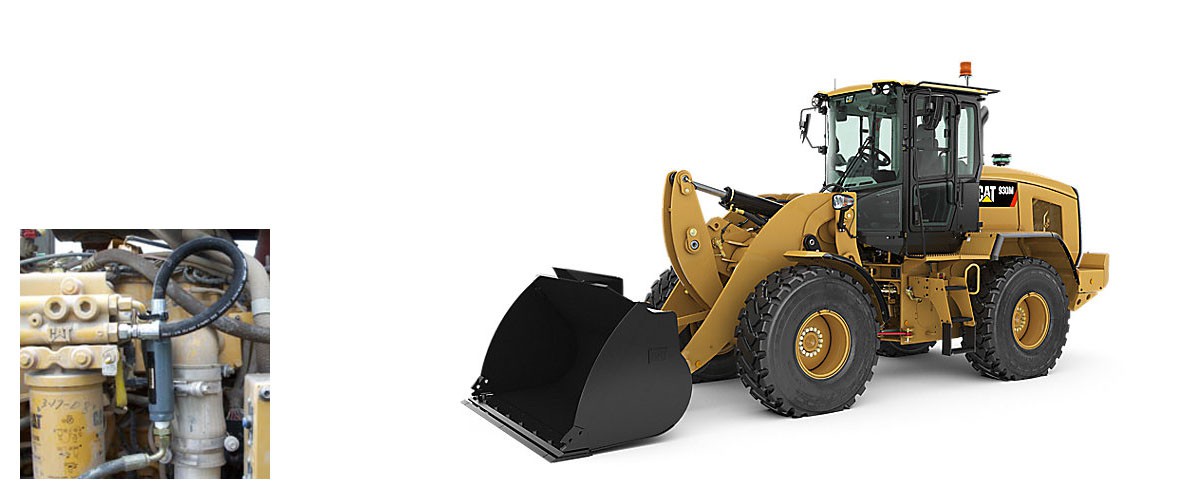
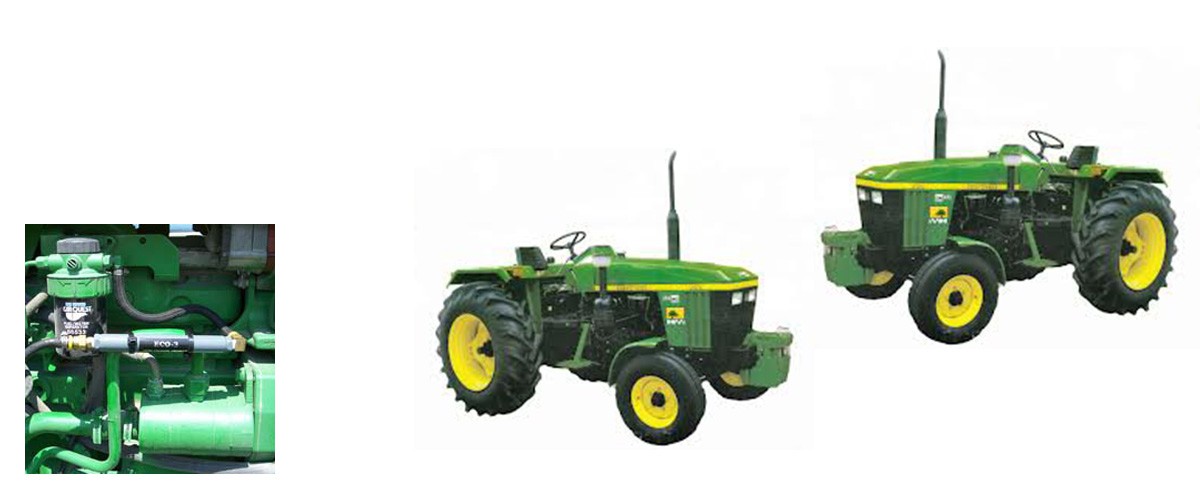
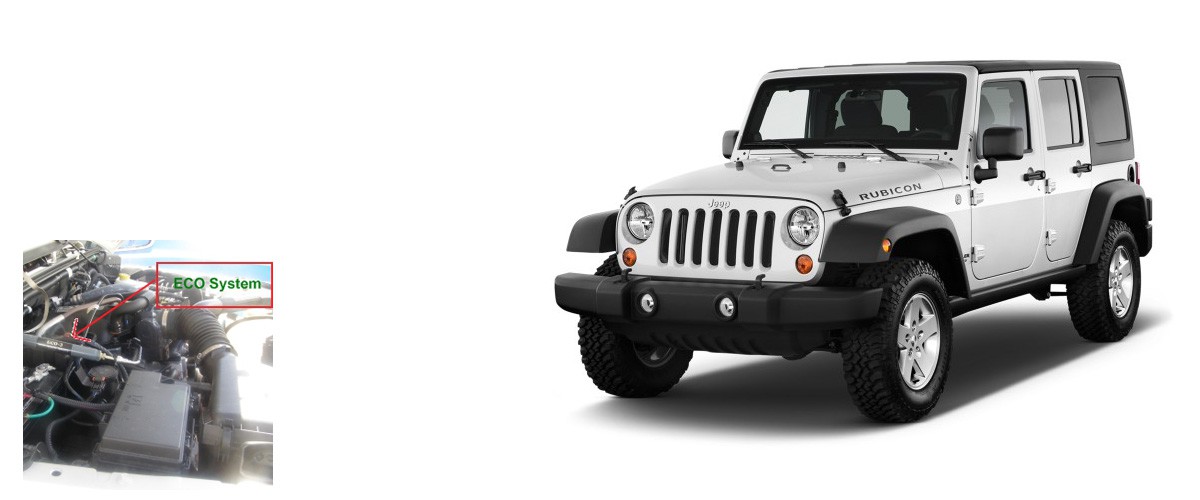
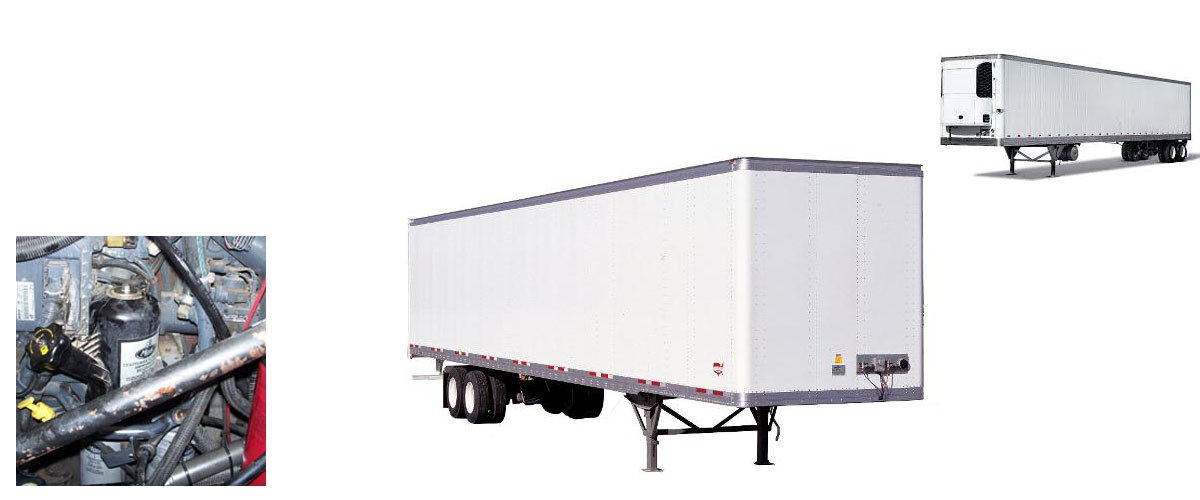
• It is easily fitted on vehicles, heating systems and other fuel combustion devices
• Toxic emissions can be reduced by up to 95%
• No servicing, consumables or power is required
• It is fitted inline on any existing fuel line and no extra pumping or filtering is required
• Unburned fuel waste is reduced by up to 95%.
• Fuel economies achieved are between 2% to 15%
• Commercial businesses could see a payback of their initial outlay within less than 2 years
• Improved power / performance in equipment using the ECO Unit
• Extend the life of a diesel particulate filter (DPF) by up to 50%
• Reduce potential exposure to occupational H & S claims arising from day to day inhalation of emissions generated by or in association with your business
• Reduced carbon build up in equipment using the ECO unit
Test Results Summarised
The specific test results are summarised here in these tables. We look at the various reductions in emissions shown after vehicles were tested and also studies carried out on fuel savings achieved from various vehicles and heating equipment.
Table 2 – looks at the reductions in emissions, these range fom 20% to 95%. It considers the range and average of the reductions achieved for various toxic gases that make up the generic term emissions.
Specific test results are analysed for Ireland (NCT results), USA and India – Click on the link for each country to view these in detail.
Table 3 – This considers a fuel economy averaging between 2% and 15%. As part of reducing emissions the ECO unit provides for a more complete burning of hydrocarbons which gives rise to fuel economy. We have analysed various results from different combustion equipment. Click on any of the various studies to get the exact test details.
Table 2
| Pollutant Emission Gases | % Reduction Range (high RPM and idle) | Average % Reduction (high RPM and idle) |
|---|---|---|
| Table 2 Pollutant gases % reduction range test results are based on vehicles tested in Ireland, USA and India. Refer to appendices 1 to 3 for details of the various tests undertaken. |
||
| Carbon Monoxide ( CO ) | 65% to 95% | 70.90% |
| Hydrocarbons ( HC ) | 50% to 95% | 58.31% |
| Oxides of Nitrogen (NOx = NO2 - Nitrogen Dioxide, NO Nitrous Oxide etc.) | 16% to 80% | 39.83% |
| Particulate Matter (PM10 & PM 2.5) | 72% reduction in the number of regenerations required and extended life of DPF filter by approximately 50%. (Regeneration units capture soot) | N/A |
| Smoke | 54% to 81% | 63.39% |
Table 3
| Study | Date of study | No of vehicles / boilers in study | Range of fuel saving % | Average % Fuel saving / efficiency | % DPF regeneration reduction due to less particulate matter (PM) |
|---|---|---|---|---|---|
| Table 3 These results are based on vehicles and laboratory tests completed in USA. Vehicles are tested based on day to day in service tests and official test centres. Laboratory tests are as indicated. |
|||||
| USA - 20 Emergency Response Vehicles | 28/10/2014 | 20 | 1.52% to 50% | 13.06% | 72% |
| Leander Buses - Texas | 01/02/2009 | 8 | 6% to 43.9% | 24.22% | Not tested |
| USI Transport | TBA | 1 | 4.45% to 8.73% | 6.59% | Not tested |
| SGS Methane Laboratory Test | 06/02/1997 | 1 | - | 11.20% | Not tested |
| SGS Propane Laboratory Test | 22/04/1997 | 1 | - | 19.80% | Not tested |
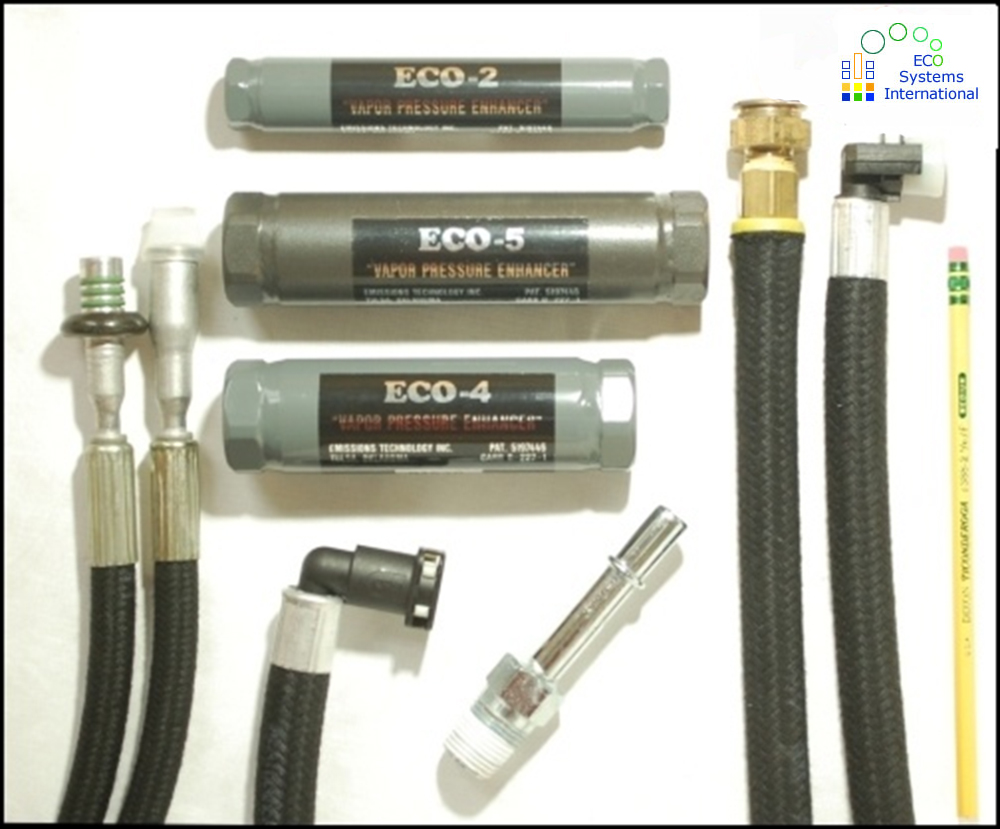
ECO Unit – Range of Units and installation pack